Background:
Since the release of ArcGIS 8, the geodatabase model
has been the primary means of storing geographic data (Price, 2016). The geodatabase allows the user to store
topological relationships between features, it automatically tracks the lengths
and areas for features, and it provides behavior and validation rules that
control how features behave, how they connect, and what attributes are allowed
(Price, 2016). It becomes clear that the
geodatabase can quickly become quite complex and thus a fair amount of planning
is necessary to create a functional geodatabase, especially for long-term
projects. In this lab, an overview of
the process of creating a geodatabase is discussed using a flood hazard map
project as a case study.
Methods:
Before actually creating the geodatabase in ArcCatalog
or ArcMap, the schema needs to be laid out to determine how it should be
created. First the parameters of the
project must be determined. For the
geodatabase to best fulfill the needs of the user, it needs to be created with
the project’s goals in mind. A good way to determine the vision of the project
and geodatabase is to talk to the intended users. Ask them what the goal of the project is and what
they want the geodatabase to do for the project. The second step is to
determine the vision of the project.
What will it be used for? Who will be able to use it? What type of geodatabase best suits the needs
of the project? After these are determined, the designer can define the
geographic characteristics, such as the area extent, the map scale, and the
projection. Some other things to keep in
mind are whether to include topology or annotations depending on the project. Then
a list of the feature classes, rasters, and tables is made along with their
relevant attribute fields and whether they are participating in topology or a
network. The final step is to create a plan for the metadata. This includes choosing a metadata standard,
what metadata will be recorded, and how often it will be updated. Once all this information has been gathered,
it must be combined into a schema for the geodatabase that will guide its
creation.
Results:
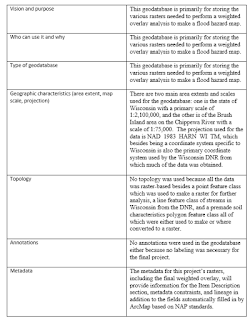
Figure 1 below shows a table that lists the necessary elements
for creating a geodatabase schema as described above using a flood hazard map
project as an example.
 | |
| Figure 1. Geodatabase schema for a flood hazard analysis project. |
Because of the heavy emphasis on raster data and the use of premade feature classes, many sections of this schema are not necessary, such as topology or annotation. It is however important to include these types of sections in other instances. for example, topology is generally used if vector objects are being created and need to interact with each other a certain way (coinciding edges).
The final portion of the geodatabase schema not
mentioned in the table above is the description of the elements of the
geodatabase such as tables, rasters, and feature classes. There are 5 primary elements that were added initially
and used for all the calculations in the project, which also appear in the
geodatabase. A 30 meter DEM of Wisconsin was added to create an elevation, slope,
and flow accumulation raster and the attribute fields of this raster are
elevation values and counts of those values.
A land cover raster was added to make the flood hazard map and has value, count, and a description field. The values and their descriptions are as follows: 1000 = Urban/developed, 2000 = Agricultural, 3000 = Grassland, 4000 = Forest, 5000 = Open Water, 6000 = Wetland, 7000 = Barren, and 8000 = Shrubland.
A line feature class of streams in Wisconsin was added from the DNR for creating a Euclidean distance raster and among a variety of attribute fields it includes the stream or river name, stream order, and the stream (line) length.
A soil characteristics polygon feature class was added to be converted to a raster, and of most importance to this project was the SCGW value field. This tells what type of soil is in that particular polygon and the values are as follows: 1 = coarse texture / high permeability, 3 = medium coarse texture / high-medium permeability, 6 = medium texture / medium permeability, 10 = fine texture / low permeability, 99 = water body, and 0 = background/”universe” polygon.
The final feature class added was a point feature class of cities in Wisconsin that was geocoded from an excel file. The attributes for this feature class include the city, state, zip code, the matching address found by the geocoder, and the status, score, and match type generated by the geocoding software.The completed geodatabase is shown below in Figure 2.
 |
| Figure 2. Final geodatabase with initial sources, rasters used in the final analysis, a scratch space for intermediary rasters, and a table of rainfall values. |
This is the final geodatabase, with the FloodMap.gdb
holding all of the feature classes that were the basis of the analysis and the
final rasters used in the weighted overlay tool. The Project_Results.gdb was used as a scratch
space for the intermediary steps. The Rainfall_Table.csv holds the city,
state, and zip code of Wisconsin cities and the corresponding MFI value for
performing the spline interpolation technique.
Behavior settings such as subtypes, coded and/or range
domains, split and merge policies, and default values were not included in this
geodatabase because most of the data was raster, which does not use these
settings, and the feature classes that were included were imported for a public
source and already completed, negating the need to create any settings. Although the rainfall data was converted to a
feature class, the necessary information was already in the excel file and the
only function performed on it was geocoding before it was used to create a
raster for analysis. However, these settings would be helpful in certain instances.
These settings would
generally be used if vector data was being created. For example, coded/range domains limit the
values that can be put in a field so data errors are avoided. Default values are good if there is a lot of
replication of values for each point, line, or polygon being created. Split and merge policies are helpful if the
created features are being split or merged, and subtypes are useful for
networks like a sewer or road system.